Technical Analysis?
Technical Analysis
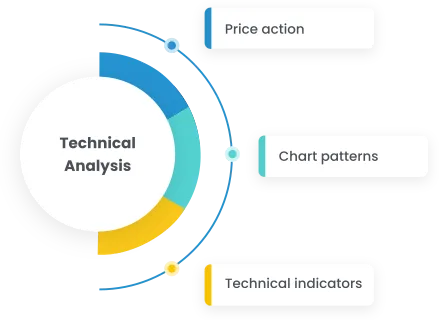
Technical analysis involves analyzing historical price movements to identify trends and patterns, aiming to assess the likelihood of future price directions.
Practitioners of technical analysis, often referred to as technical traders or analysts, hold the belief that crucial information about price movements is embedded in the charts. According to this perspective, by examining historical price actions, one can gauge current trading conditions and anticipate potential future price movements.
How do they achieve this? Technical traders search for recurring patterns that have manifested in the past and generate trade ideas based on the premise that prices may replicate previous behaviors.
The Forex Markets
Charts, or more specifically, price charts, happen to be the first (and most important) tool that every trader using technical analysis needs to learn.
No matter their trading strategy, technical traders analyse these price charts in order to spot patterns, trends, find entry & exit points, predict price movement and more. These are the four most popular types of price charts used to trade foreign exchange:
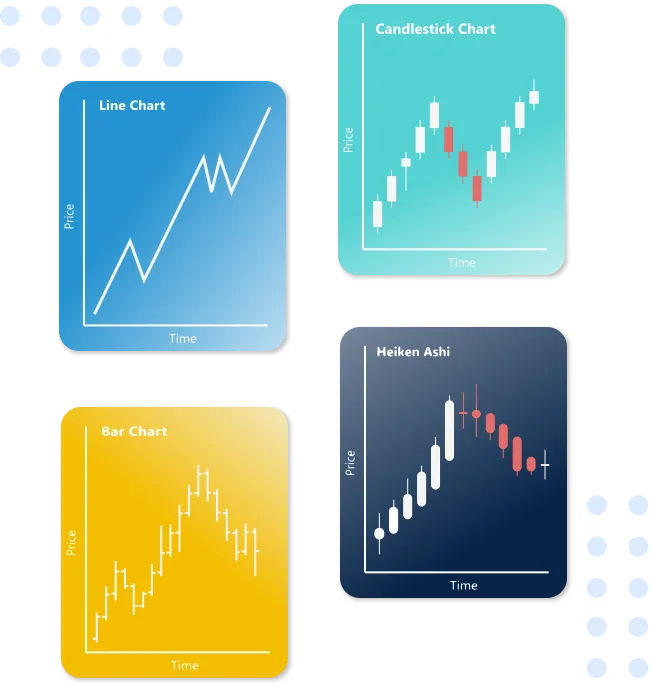
Chart Patterns
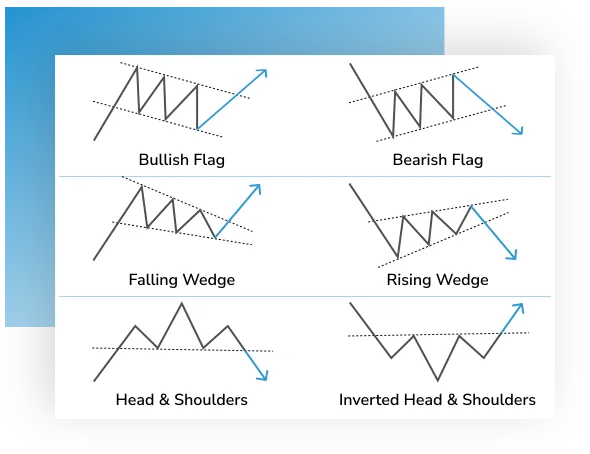
Chart patterns, also known as trading patterns, are formations within price charts that play a crucial role in assisting traders in predicting potential future price movements based on historical patterns.
To identify and recognize chart patterns, technical analysts utilize drawing tools like horizontal lines and trend lines to connect key price points, such as closing prices or highs and lows, over a specific time frame.
These patterns can be observed on various time scales, ranging from seconds and minutes to hours, days, or even months, and can be applied to different types of charts, including line, candlestick, and bar Forex charts.
Among the widely recognized chart patterns are wedges, head and shoulder formations, double and triple tops and bottoms, as well as flags.
Candlestick Patterns
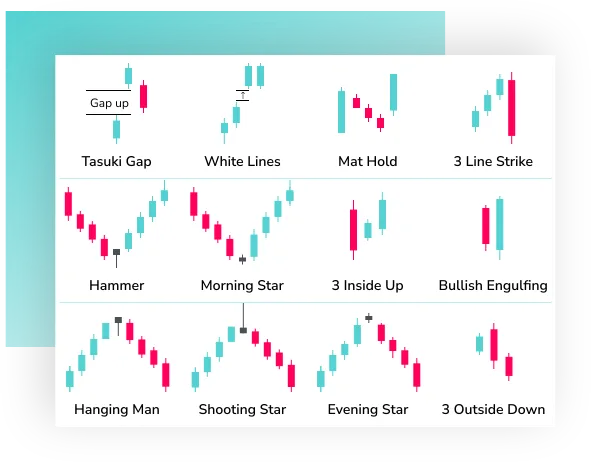
Candlestick patterns serve as potent indicators employed by Forex traders to anticipate future price movements and discern potential trading prospects. Traders identify these patterns through an analysis of historical price data and trends.
The formation of candlestick patterns involves grouping candlesticks in specific arrangements. Whether signaling a reversal or continuation, these patterns furnish traders with insights into potential upcoming developments.
There exist three main categories of Candlestick patterns:
Continuation Patterns (task gap, white lines, mat hold, line strike, separating lines)
Bullish Reversal Patterns (hammer, morning star, three inside up, bullish engulfing)
Bearish Reversal Patterns (hanging man, shooting star, evening star, three outside down)
Technical Indicators
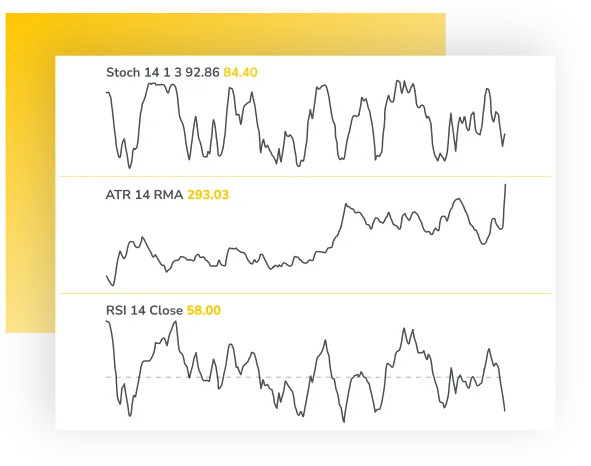
Forex technical indicators, often referred to as technicals, constitute a vital tool in navigating the Forex market. When employed judiciously, these indicators enhance the likelihood of traders making profitable decisions.
An extensive array of technical indicators is available for analyzing trends, offering price averages, measuring volatility, and they manifest in diverse forms and magnitudes.
Examples of such indicators include:
Moving Averages
Average True Range (ATR)
Relative Strength Index (RSI)
Stochastic Oscillator
Let’s talk.
Embark on your Forex and Cryptocurrency trading journey with confidence! We provide Expert Insights and dedicated Mentors to guide you every step of the way toward Financial Success in the dynamic world of Forex and Crypto markets.

